Real-time Laboratory Insights Using Reports and Dashboards in Lockbox LIMS

Why Reports and Dashboards Matter In Lockbox LIMS
Many reporting tools available in Lockbox LIMS are underused. Lockbox LIMS natively contains powerful report and dashboard tools because it is built using the Salesforce platform. Lockbox LIMS users do not need third-party software to build reports and dashboards that provide invaluable insights into lab performance, sample tracking, inventory management, equipment usage, etc. Here, we discuss the power and importance of utilizing reports and dashboards within Lockbox LIMS.
What are Reports and Dashboards?
Reports: Organized Views of Lockbox LIMS Stored Data
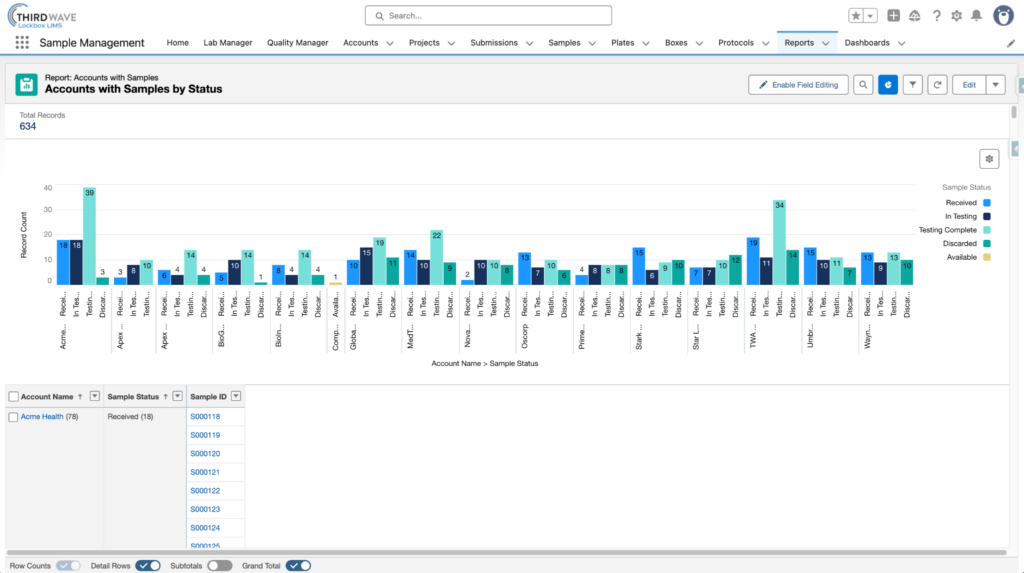
Reports allow users to query and summarize information stored in Lockbox LIMS. Users can filter, group, sort, and calculate across any objects. Reports are generated in the following formats: tabular (basic data lists), summary (row-grouped data), matrix (row and column-grouped data), or joined formats, which utilize distinct report blocks to offer various metrics of your laboratory data.
Dashboards: Visual Displays of Key Metrics
Dashboards present report data as charts (e.g., horizontal or vertical bars, stacked bars, gauge, funnel, scatter), graphs, tables, or tallied metrics. Texts and images can also be added to provide additional information. Filters can be added to update the displayed data based on the selected condition. Multiple reports can be combined into a single view on a dashboard, providing at-a-glance visibility. Dynamic dashboards are configured for the specific user viewing them.
What Is the Difference Between Reports and Dashboards?
Reports provide detailed views of laboratory data and allow users to filter, group, and analyze information. Dashboards use one or more reports to present key metrics visually through charts, graphs, gauges, and summary statistics. Reports are used for analysis, while dashboards are designed for monitoring performance.
Each dashboard can hold a maximum of 25 components, but only 20 components can be report-based charts or tables. The remaining 5 components can only contain images or rich text. The user interface can only display the first 2,000 rows of a report. To view additional rows, users will need to export the full report to Excel or a CSV file.
Lockbox LIMS users can subscribe to up to 7 reports and 7 dashboards. Each Lockbox LIMS org is allowed up to 500 dashboard and 500 report subscriptions per hour. Dynamic dashboards require heavy processing, so Lockbox orgs have hard limits of 5 dynamic dashboards that can be created and stored.
The dashboard will display data in the same way it is structured in the report, maintaining the groupings, summaries, and blocks. The standard report and dashboard features are usually sufficient for Lockbox users’ needs. For more complex, multi-dimensional business analysis that bypasses row limits and merges external data, Tableau will be needed. Tableau connects to the broader enterprise data landscape, enabling advanced data blending and highly customized visual worksheets, and is typically only practical for use by skilled business analysts.
Why Reporting Is Powerful in Lockbox LIMS
The reporting capabilities and tools are built directly into the platform, so there is no need for third-party tools or exporting to spreadsheets.
Real-Time Reporting Without Third-Party Tools
Reports are extremely configurable, and they update in real time. Real-time updates are a major advantage of Lockbox LIMS reporting capabilities when compared to many other analytical tools. Any user can create their own report by just dragging and dropping the elements needed to display their data. No coding is involved. Built-in automation allows users to configure automatic emails of periodic reports at set intervals, such as daily, weekly, or monthly. Lockbox LIMS builds on Salesforce security features to provide effective protection of sensitive data. Administrators can customize permission settings to determine who can see and report on data and who can access reports and dashboards.
Cross-Object Reporting Across Laboratory Workflows
Data can be accessed across Lockbox objects and combined into a single report. This allows users to see the data that matters most to them based on their role and function within their organization. For example, users can:
- Analyze relationships between projects, samples, and results
- Track data across multiple stages of workflows and gather metrics from each stage
- View operations and scientific information in one report
Automated Report Distribution
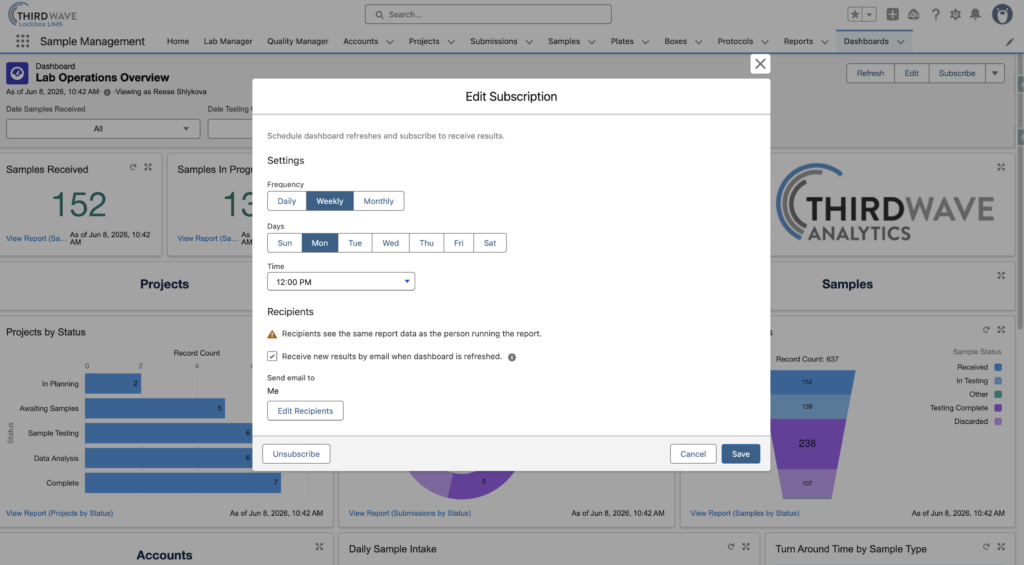
Automated report distribution enables users to subscribe themselves or others to reports and dashboards and receive periodic email notifications. Report subscriptions can be configured to send notifications on a recurring schedule or when specified conditions are met. For example, a lab manager could receive an email notification when a sample backlog exceeds a defined threshold, or a procurement associate could receive an email when the inventory stock of a particular item reaches a predetermined amount.
Dashboard subscriptions have similar functionality and can distribute snapshots of dashboard data to users. Scheduled dashboard refreshes ensure that subscribers receive the most current information available.
Utilizing automated report and dashboard distribution greatly reduces manual reporting work and ensures that key personnel or decision-makers have the most up-to-date information at their fingertips.
Secure Reporting Based on User Permissions
The ability to create a report or to access an existing report is determined by the Lockbox LIMS security model set up during implementation and maintained by your organization’s IT team. This means that users who do not have permission to view or edit data cannot configure or view a report that uses that data.
What Laboratory KPIs Should You Track?
Knowing which key performance indicators (KPIs) or laboratory metrics you need to track depends heavily on your laboratory type and industry. Academic labs care about different metrics than clinical, manufacturing, or biorepository labs. We can make some generalizations about data tracking, and the good news is that the native reporting tools in Lockbox LIMS allow you to report on any KPI that is essential to your lab. Laboratories utilize Lockbox LIMS reports and dashboards to track, analyze, and present many types of data, including the following KPIs:
Operational KPIs
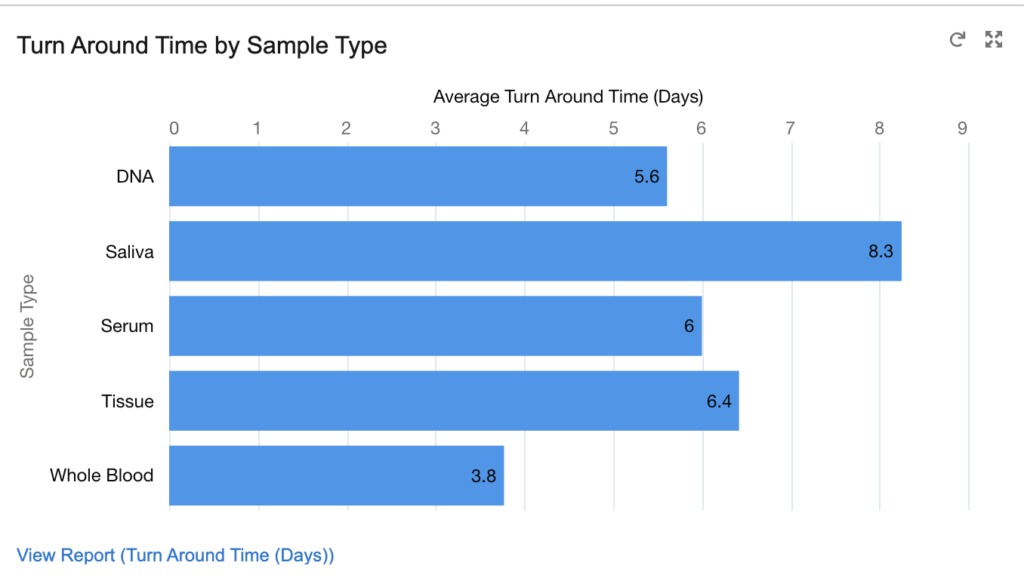
- Sample turnaround time
- Samples processed per day
- Backlog volume
- On-time completion rate
- Number or percentage of rejected samples or completed tests
Quality KPIs
- CAPA completion rates
- Failed quality control events
- Deviations by month
- Training completion status
Inventory KPIs
- Inventory stock levels
- Reagent expiration risk
- Inventory consumption trends
Inventory KPIs
- Inventory stock levels
- Reagent expiration risk
- Inventory consumption trends
Benefits of Reports and Dashboards
The reports and dashboards features inherent to Lockbox let users get more out of their LIMS data. Lockbox LIMS customers use the tools to improve visibility, support decision-making, eliminate manual reporting, support compliance and audit readiness, and easily enable executive-level monitoring.
Improve visibility
Reports and dashboards allow users to quickly see real-time metrics specific to their own activity without the need to dig into data. Users can easily monitor sample volume and turnaround times, view the status of active projects and tasking activities, and track backlogs and identify bottlenecks.
Support Decision Making
Well-configured reports and dashboards support decision-making by providing Key Performance Indicators (KPI) to turn raw data into actionable intelligence. Any KPI falling behind the objective can be easily identified in a real-time updated dashboard and addressed accordingly. For instance, sample processing bottlenecks that are highlighted in a lab manager’s dashboard provide the necessary data for an informed decision to add resources on a delayed execution in order to maintain turnaround time commitments.
Eliminates Manual Reporting
Just as your Lockbox LIMS adoption may have replaced spreadsheet-based processes, so your reporting can also be done without heavy reliance on spreadsheets. The reporting capabilities within Lockbox can replace spreadsheet-based summaries and minimize time spent gathering data and metrics. Even the sending of reports can be automated within Lockbox. Authorized users can schedule reports for automatic periodic email delivery to internal users or external customers. Reports are easily downloadable, giving users the flexibility to share data snapshots in a presentation or send them via email.
Supports Compliance and Audit Readiness
Maintaining regulatory compliance is complex. Lockbox LIMS provides consistent, traceable system-generated reports for quality assurance and management. With the reporting capabilities in Lockbox LIMS, users can provide auditors with accurate documentation regarding training and competency, equipment logs, quality control, inventory and reagents, chain of custody, and CAPA reports.
Enables Executive-level Monitoring
Executives do not want to dig through their LIMS to pull out key performance indicators (KPIs). Lockbox LIMS users can present KPIs in clear visualizations using dashboards to share performance metrics with management and stakeholders. Reports and dashboards are very easy to configure. A CEO can create reports and dashboards quickly to get answers to questions that matter to them. Reports can be sent ahead of meetings so that the meeting can focus on solutions and actions instead of talking about data and reading the numbers.
Examples of Laboratory Reports and Dashboards in Lockbox LIMS
Lab Operations Dashboard
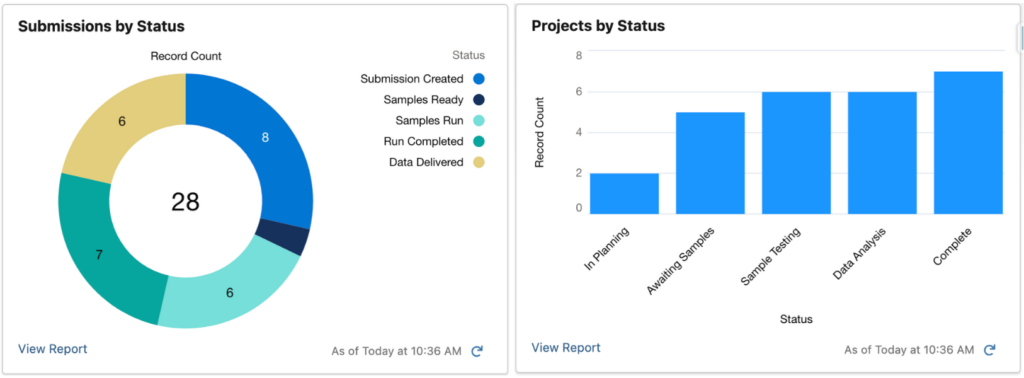
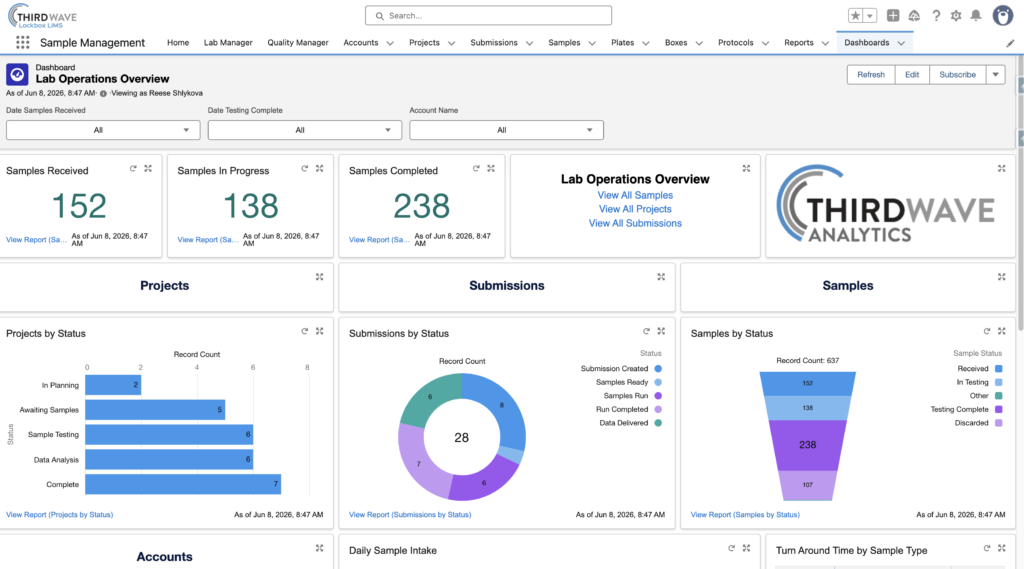
This is an example of a Laboratory Operations dashboard. In this example, we see metric charts summarizing the number of received, in progress, and completed samples. There are also bar, donut, and funnel charts showing projects, submissions, and samples organized by status. This dashboard also includes filters so users can filter the report data by dates and account names.
Project Report
This is an example of a Project report. In this example, we can see the project start date and the number of samples in each status by month. Underneath the graph, you can see the projects per month and the status, account name, project name, and submissions for each project. Clicking on the project, account, or submission ID will take you to the specific records.
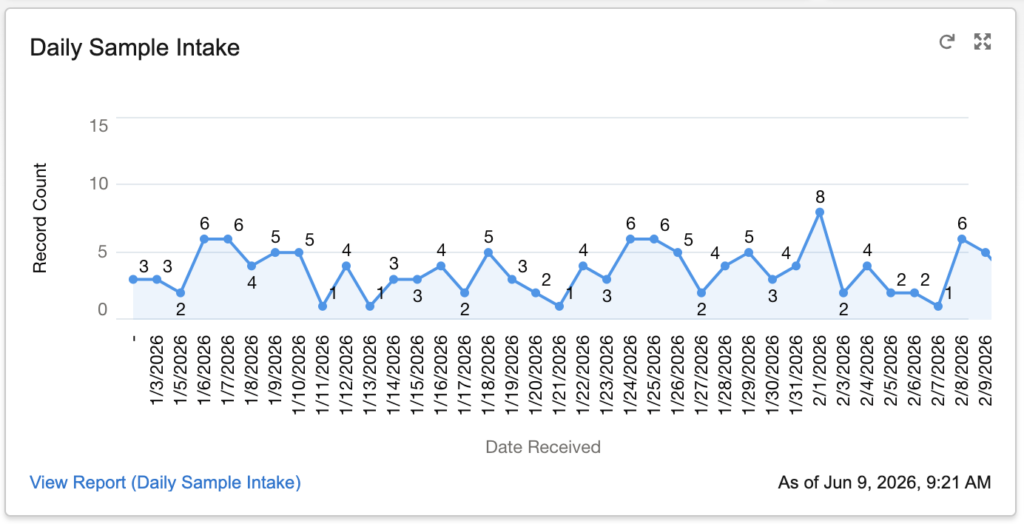
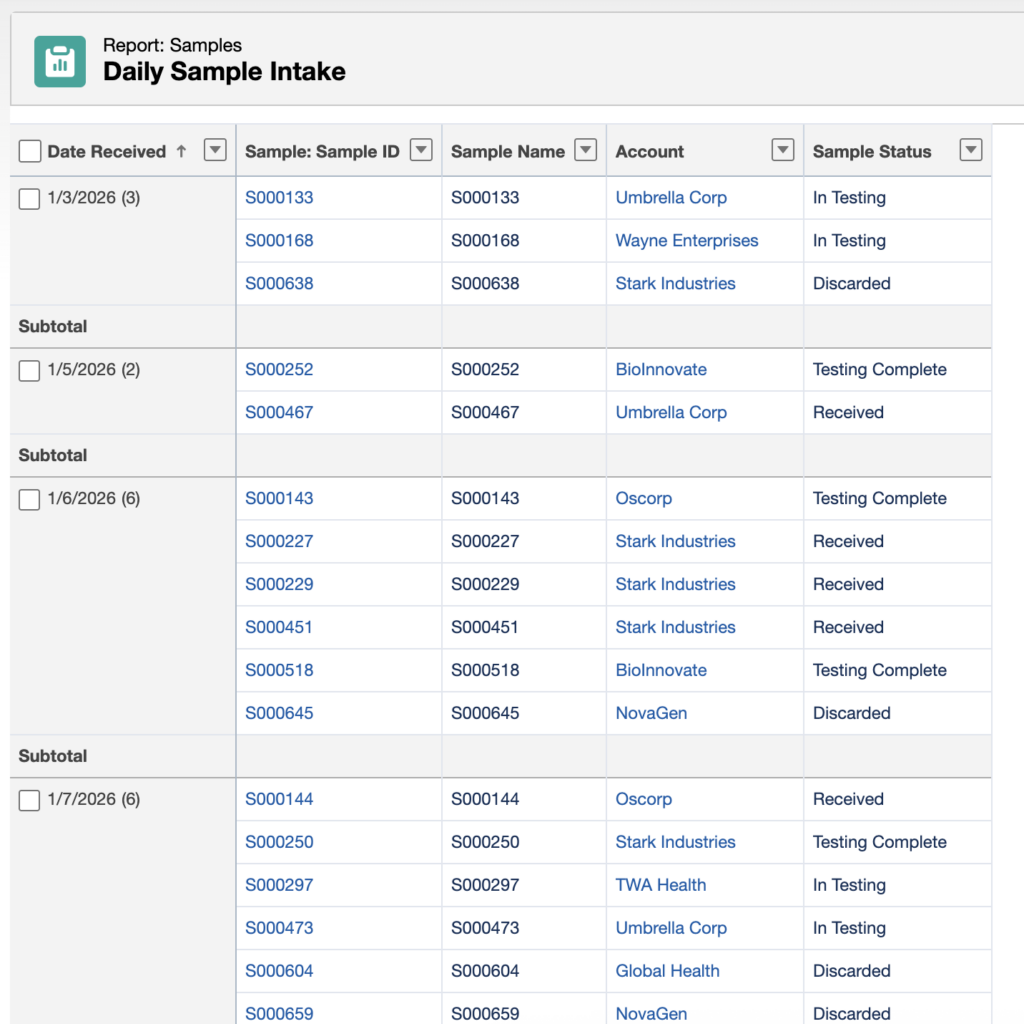
Sample Report
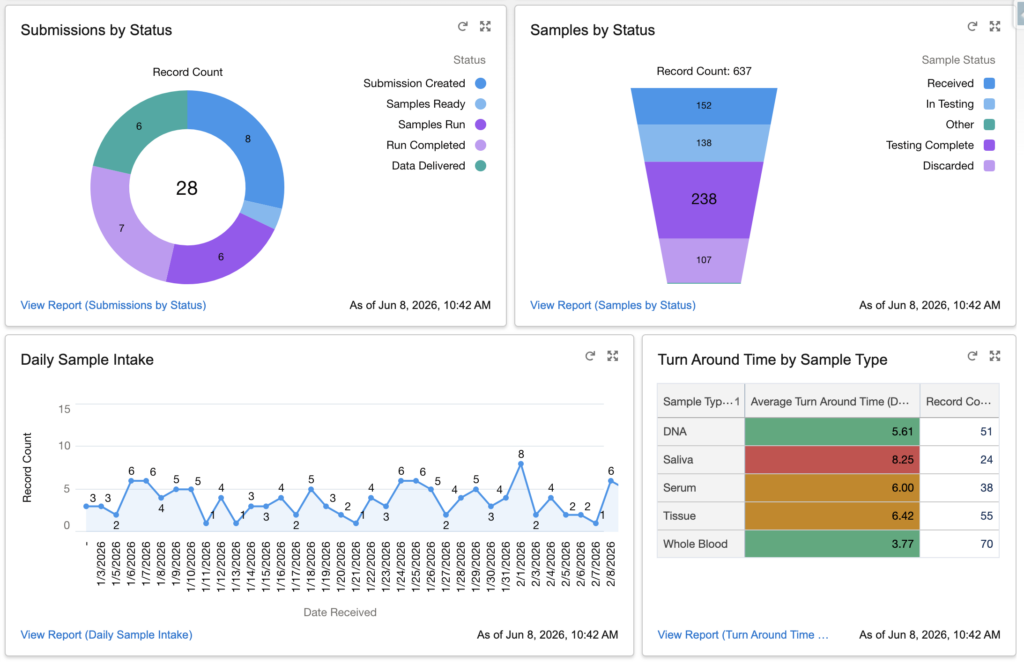
This is an example of a Sample report showing the number of samples received daily. In this example, we can see the date the samples were received along the x-axis and the number of samples received (record count) along the y-axis. The table prepared during chart configuration includes the sample ID, sample name, account, and sample status. The table is grouped by date received.
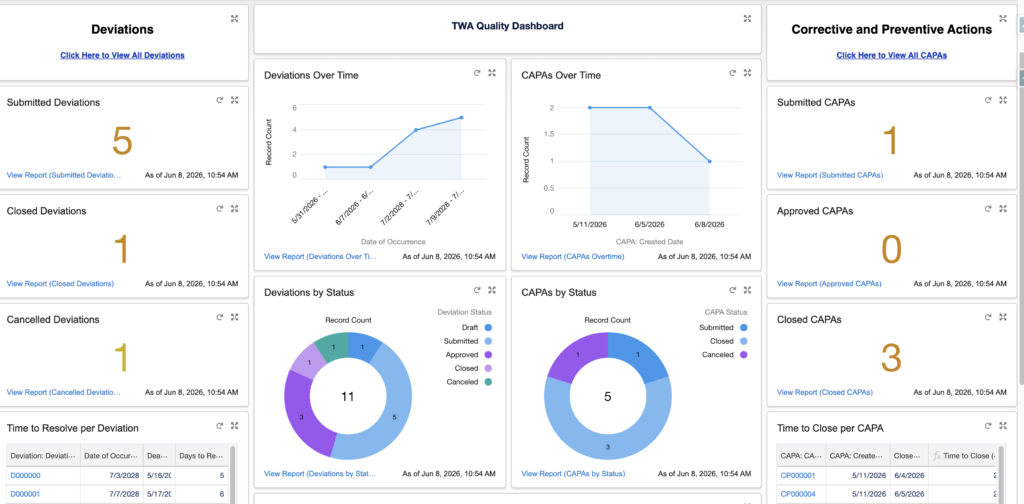
Quality Dashboard
This is an example of a quality management dashboard. In this example, we see the total number of submitted, closed, and cancelled deviations and the total number of submitted, approved, and closed CAPAs, along with graphs of deviations and CAPAs over time and donut charts of deviations and CAPAs by status.
How to Create Reports and Dashboards
Creating effective reports and dashboards starts with defining a key question to answer. This focuses your attention on the key metrics that provide the most relevant, meaningful data. Use filters strategically and design the report or dashboard with your audience in mind. Effective use of filters, filter logic, and cross filters will provide beneficial insights.
Step-by-Step Report Creation
Follow these high-level steps to create an effective report. Additional resources can easily be found online from Salesforce Trailhead articles, YouTube tutorials, and Google searches.
How to Create a Report
- Log in to Lockbox and click the Reports tab in the top navigation bar. If you don’t see it, click the App Launcher (grid icon, top-left) and search for “Reports.”
- Click New Report in the top-right corner.
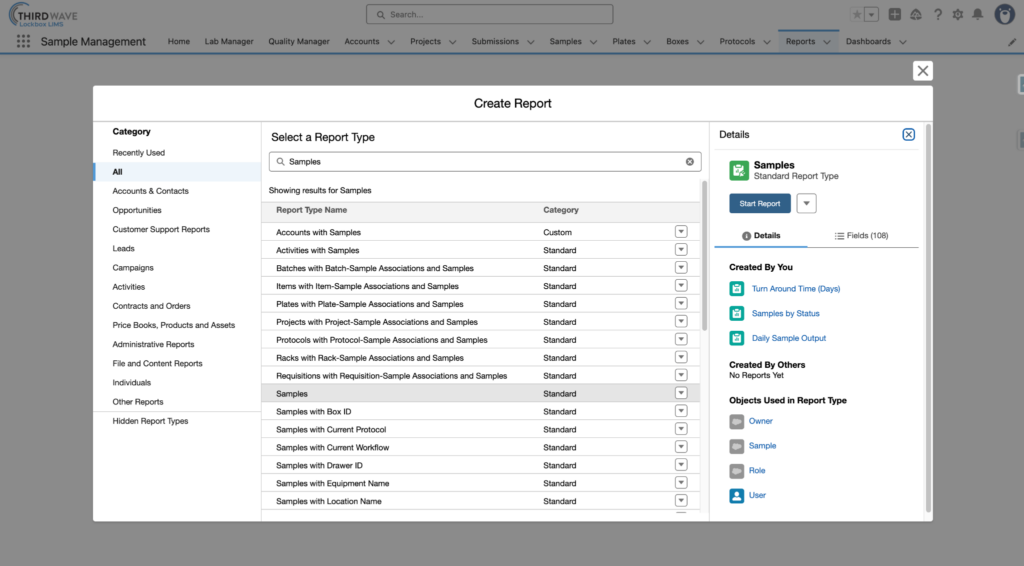
- A Report Type selector will appear. Report Types function as the foundational templates that determine which records and fields are available within a report. Search for the object you want to report on (e.g., Samples, Tests, Batches) and click Continue.
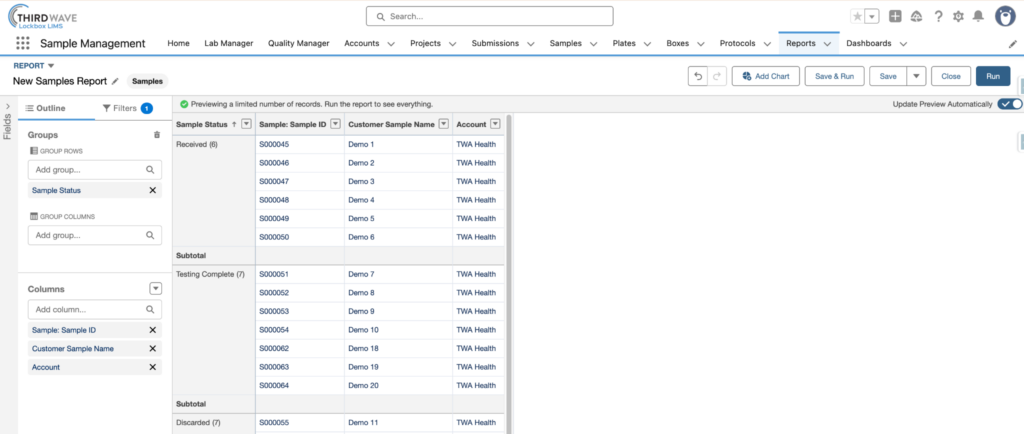
- The Report Builder will open. Use the left-hand panel to:
- Add or remove columns (fields to display)
- Set filters to narrow your data
- Add groupings if applicable
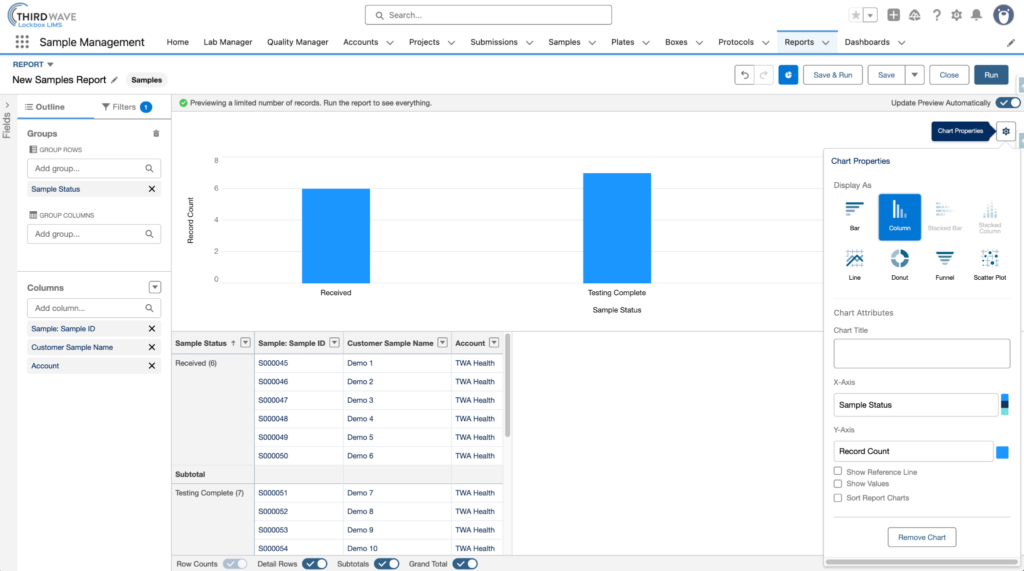
- Click Add Chart to add a chart. Select from the various chart types based on how the data should be displayed.
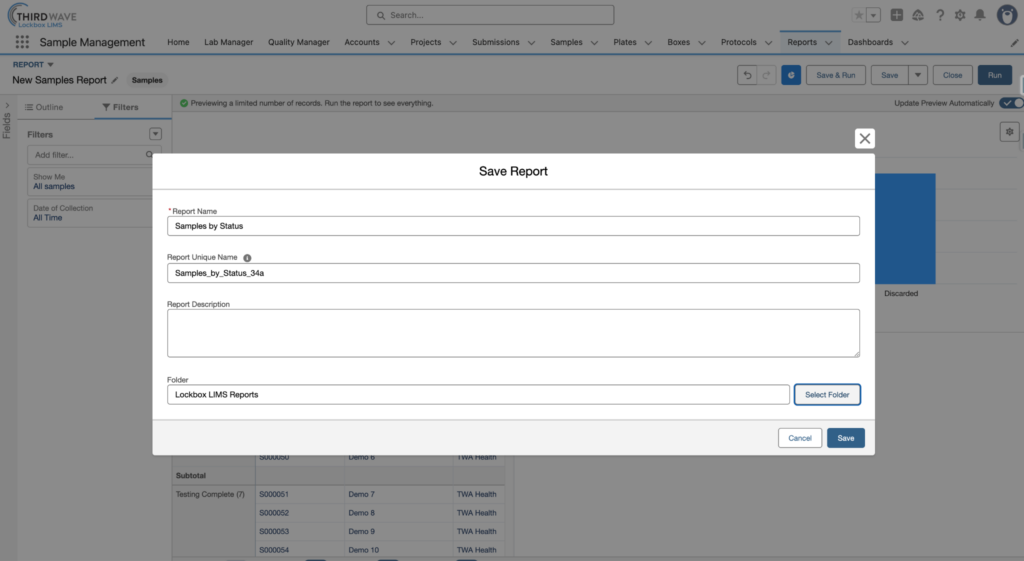
- Click Save & Run, give the report a name, choose a folder to store it in, and click Save.
How to Export a Report
- Open the report you want to export (from the Reports tab).
- Click the Export button in the top-right corner.
- Choose your export format:
- Formatted Report – exports as .xlsx (Excel), preserving headers, groupings, and filter details.
- Details Only – exports each row without formatting.
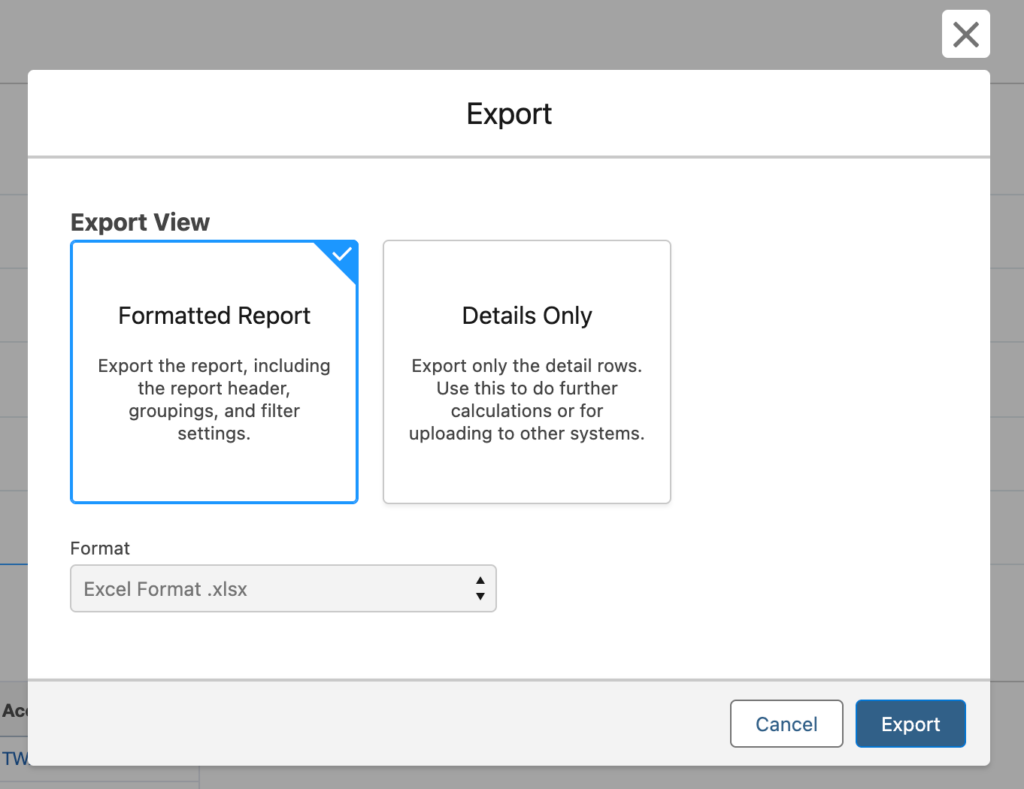
- Click Export. The file will download to your computer.
How to Filter Reports
Filters let you narrow down which records appear in your report. You can add them during creation or when editing an existing report.
- Open the report and click Edit.
- In the left-hand panel, click the Filters tab.
- Click Add Filter and select the field you want to filter by (e.g., Date of Collection, Status, Sample Type).
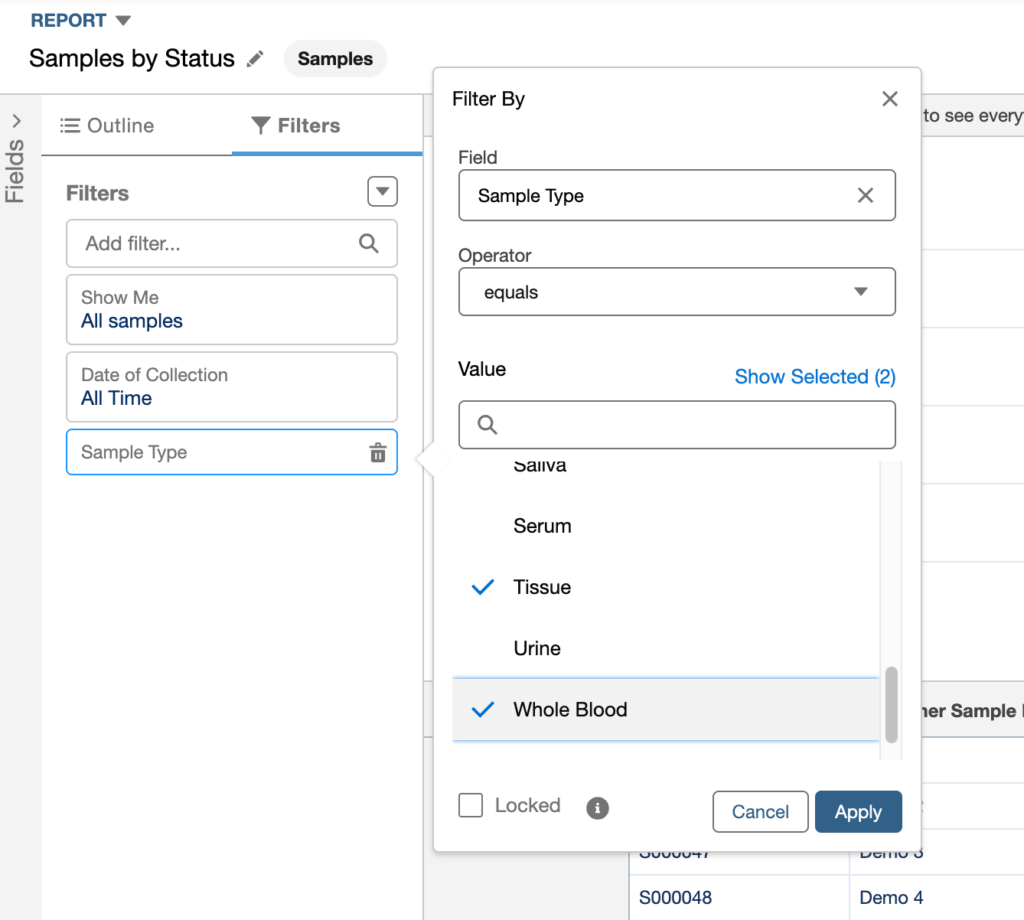
- Set the operator (e.g., equals, greater than, contains) and enter the value.
- Click Apply. Multiple filters can be stacked – all filters apply together by default (AND logic).
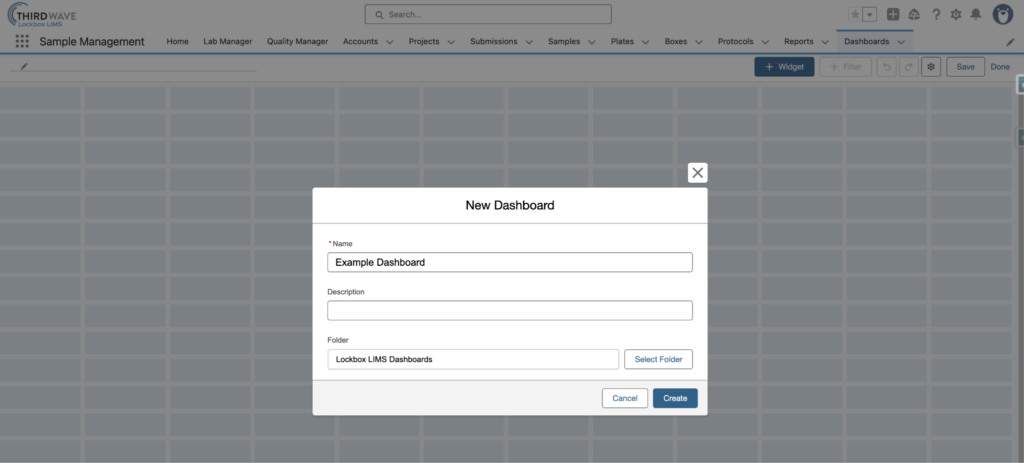
Step-by-Step Dashboard Creation
To create a dashboard within Lockbox, start by navigating to the Dashboards tab, then click New Dashboard.
- Give the dashboard a name and select the folder where the dashboard will be stored. Click Create.
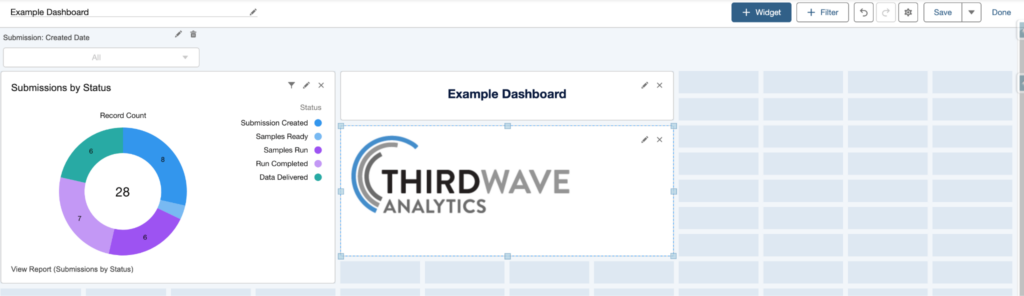
- Add widgets to the dashboard by clicking the + Widget button.
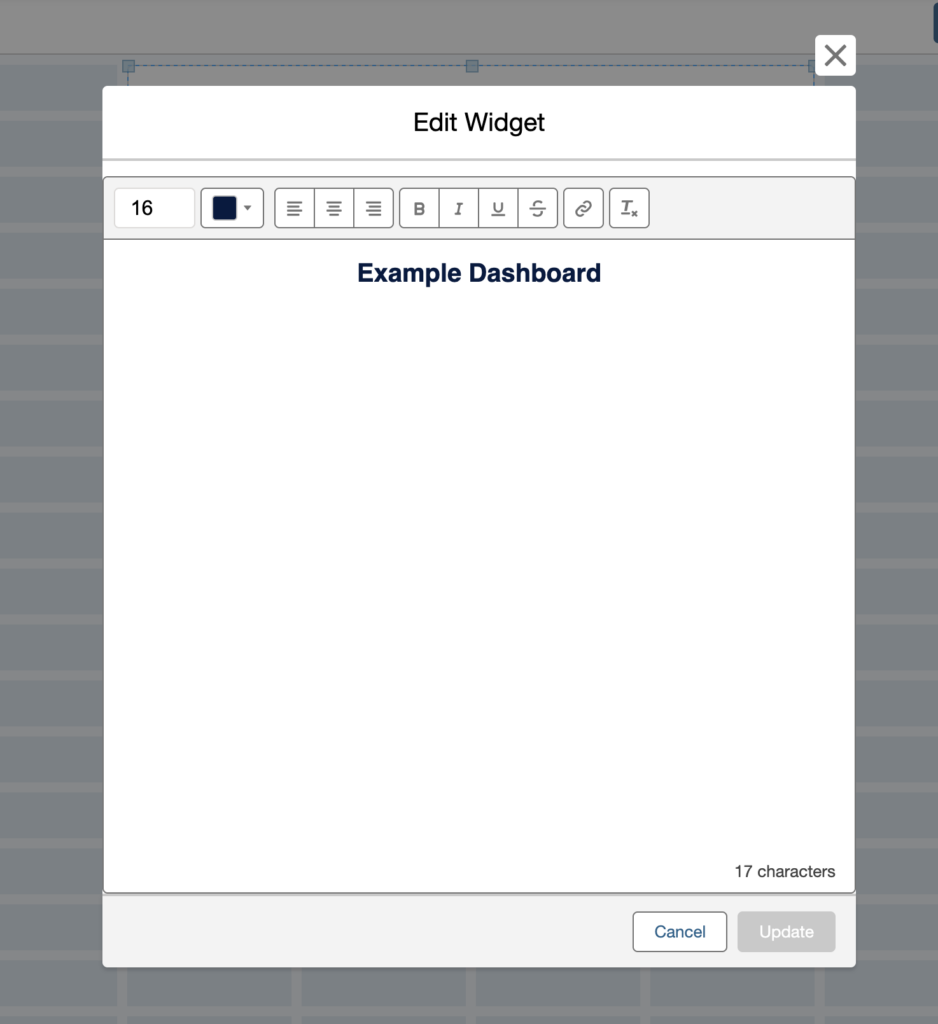
- Text – drag and drop text widgets onto the dashboard to add custom text.
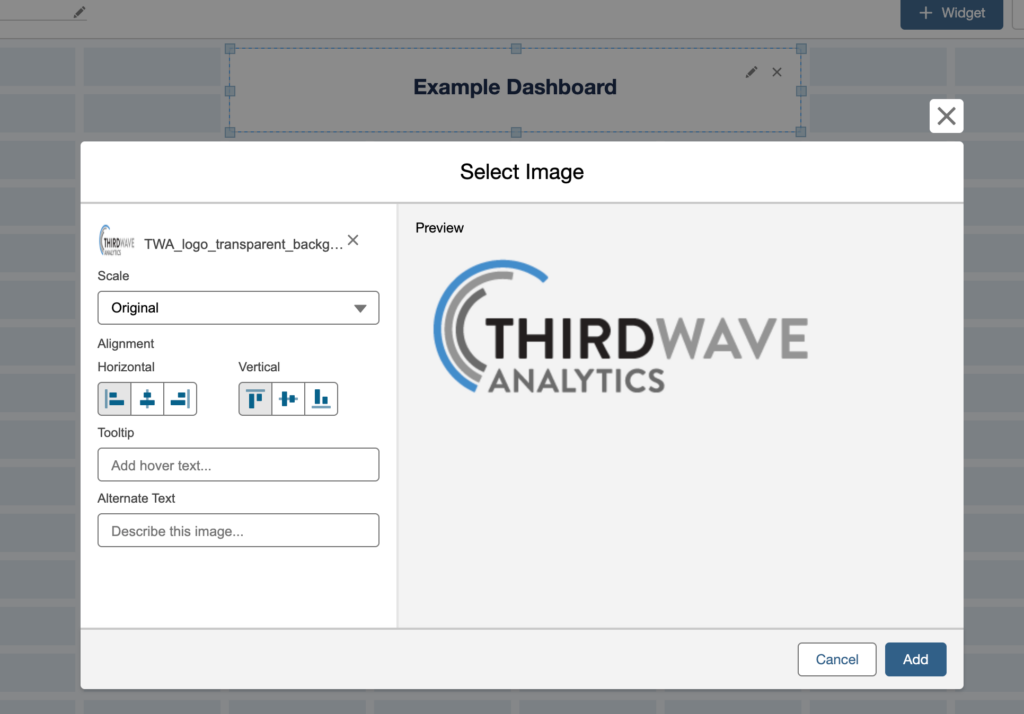
- Images – drag and drop image widgets onto the dashboard to add images.
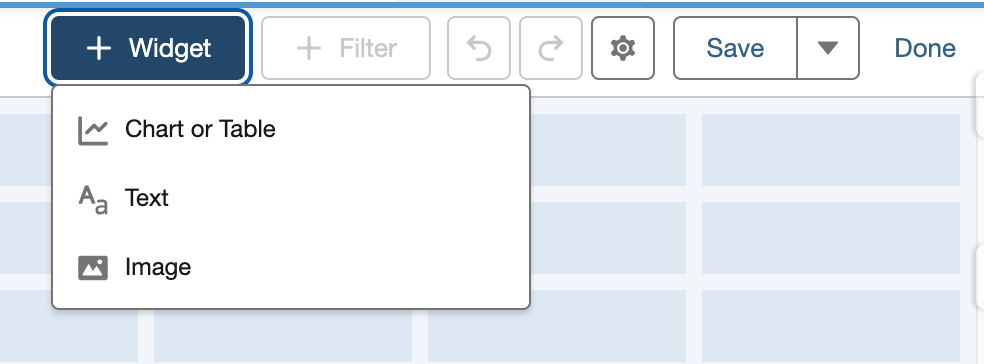
- Tables & Charts – drag and drop reports into the dashboard to add tables and charts.
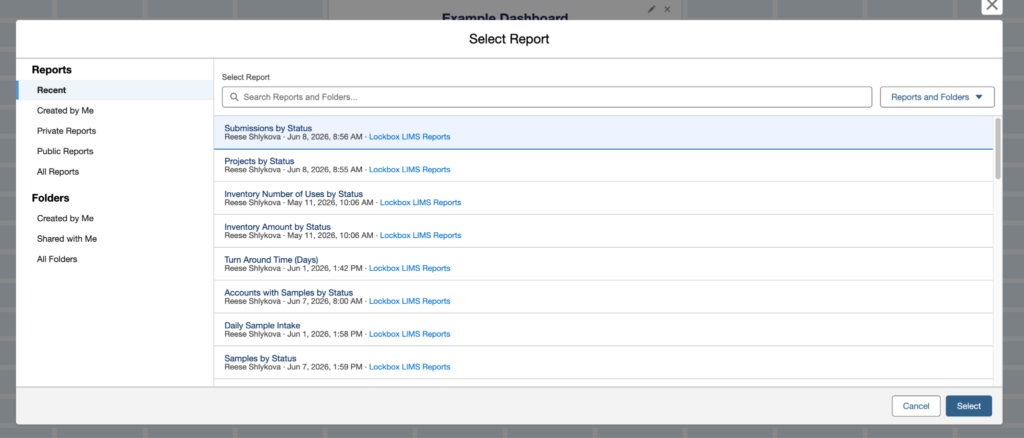
- Select the report you want to add.
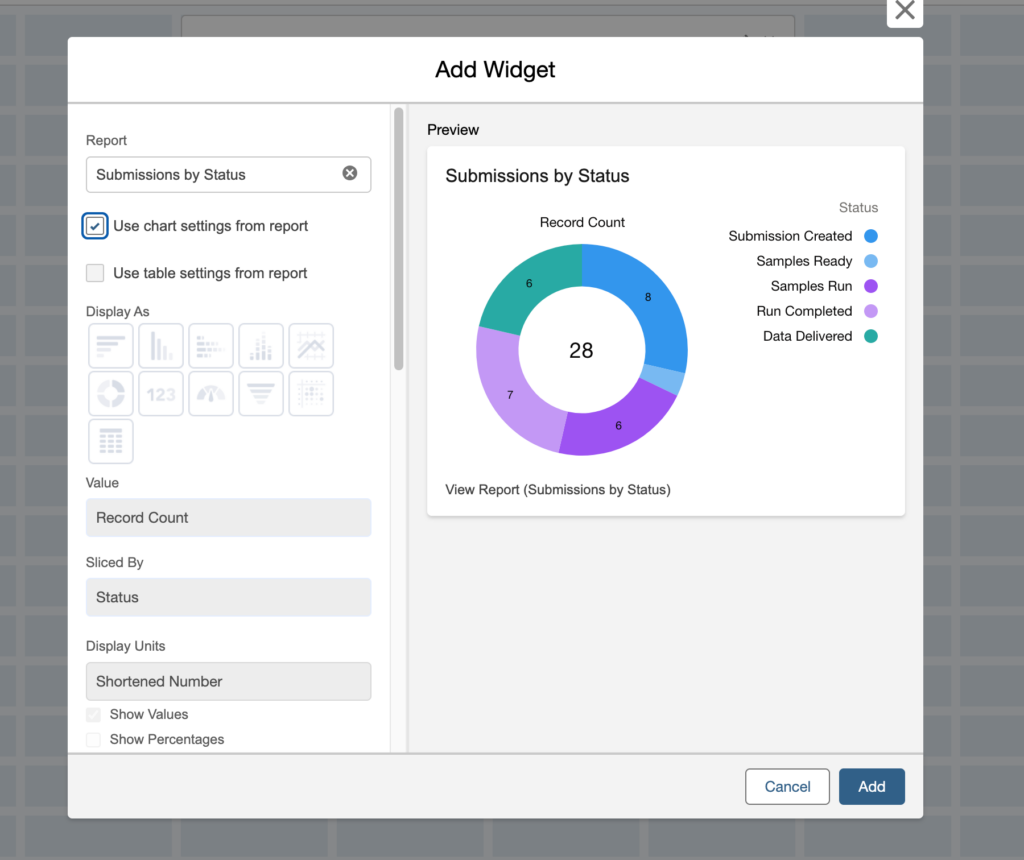
- Configure the chart, then click Add. Click “Use chart settings from report” to maintain the same configuration as defined during the report-building process. Click “Use table settings from report” to display the table only.
How to Filter Dashboards
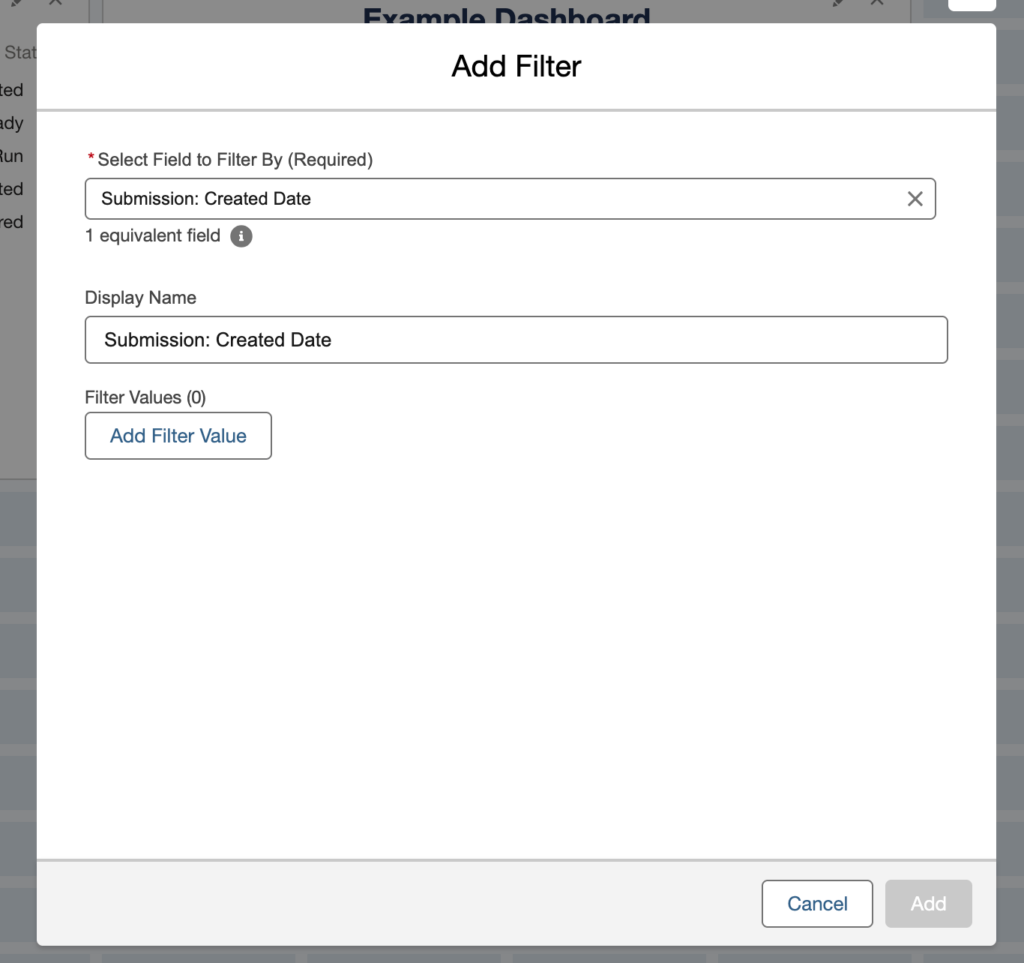
- Add filters – add a filter to limit the record data from the reports that will be added to the dashboard.
- Click the “+ Filters” button
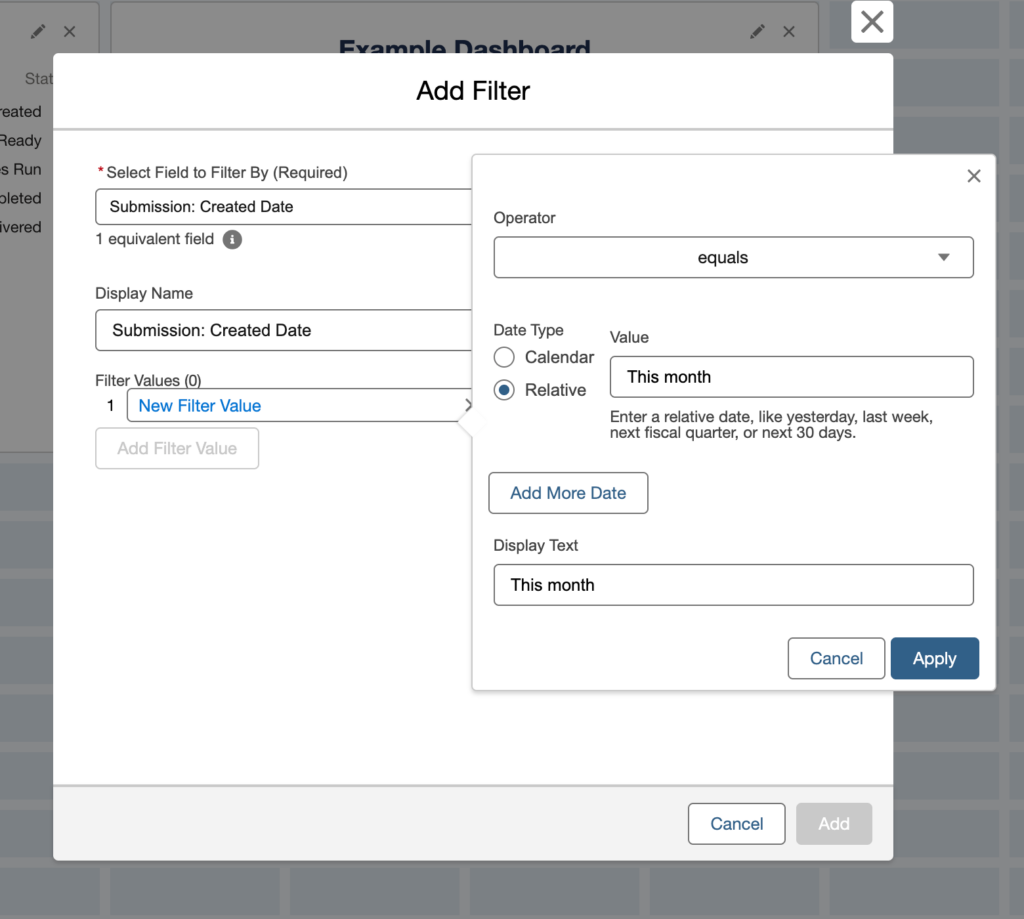
- Select the field you want to filter by (i.e., Status, Created Date, Sample Type)
- Select Add Filter Value to define the values that will appear in the filter drop-down list.
- Once all filter values have been added, click Add.
- All filters will be visible at the top of the dashboard.
- Once complete, click Save, then Done to view the finished dashboard.
Unlock More Value From Lockbox LIMS
Lockbox LIMS reporting and dashboard tools give laboratories the opportunity to move beyond data collection to real-time operational insight at the click of a button. With well-configured reports and dashboards, users can monitor workflows, improve turnaround times, support compliance initiatives, and provide executives and stakeholders with meaningful performance metrics without relying on spreadsheets or third-party reporting tools. Lockbox LIMS empowers teams to make faster, more informed decisions using the data they already collect.