Advanced Reports and Dashboards in Lockbox LIMS
Custom Report Types, Dynamic Dashboards, and Sharing
Most Lockbox LIMS users are comfortable building a basic report: pick a report type, add a few columns, apply a filter, and run it. But sooner or later, a question comes up that the standard reports can’t answer. Maybe you need samples, test results, and account data in one report, or a single dashboard that shows each user only their own samples, or a way to share results with external customers through the portal.
Because Lockbox LIMS is built on the Salesforce platform, labs have access to the full power of Salesforce reports and dashboards, applied to Lockbox objects like Samples, Submissions, and Tests. In this post, we walk through three features that take your reporting further: custom report types, dynamic dashboards, and report and dashboard sharing for both internal and external users.
Standard Report Types vs. Custom Report Types
What Is a Standard Report Type?
A standard report type is a pre-built template that defines which objects, fields, and record relationships are available when you create a report. You will find them for standard Salesforce objects like Accounts and Contacts, as well as for Lockbox objects like Samples, Submissions, and Tests.
How Are Standard Report Types Made?
Standard report types are generated automatically. This means you will already find standard report types for salesforce and Lockbox objects. If you make any custom objects, a standard report type will be automatically generated when Allow Reports is enabled on that object.
To check this setting for a specific object:
- Open Setup and go to Object Manager.
- Select the object.
- In the Details section, click Edit and confirm that Allow Reports is selected.
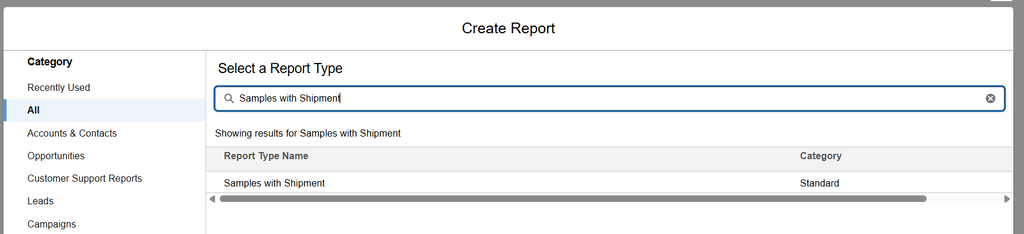
Salesforce also builds relational report types automatically based on how objects are connected through master-detail and lookup relationships. For example, if you add a lookup field from Sample to Shipment, a new standard report type called Samples with Shipment becomes available in the Reports tab.
When Standard Report Types Fall Short
So what happens when you have looked through all the standard report types and still can’t build the report you need?
Say you want to see all samples with their test results, grouped by state code. If you search for a “Samples with Tests” report type, nothing comes up. You could use the standard Tests with Sample report type, which exists because Tests have a lookup to Samples, but it won’t let you reach fields on objects related to the Sample through other lookups. The state code lives on the Account, so it is out of reach.
When you hit this wall, it is time to start thinking about custom report types.
What Is a Custom Report Type?
A custom report type removes many of the limits of standard report types. With a custom report type, you can use:
- Multi-object reporting: Combine more than two objects in one report, such as Accounts, Submissions, and Samples.
- Lookup relationships: Include fields from objects connected through lookup fields.
- “With” or “without” data: Show records whether or not they have related child records, such as Samples with or without Tests.
- Layout cleanup: Control which fields appear by default and organize them into clear sections.
How to Create a Custom Report Type in Lockbox LIMS
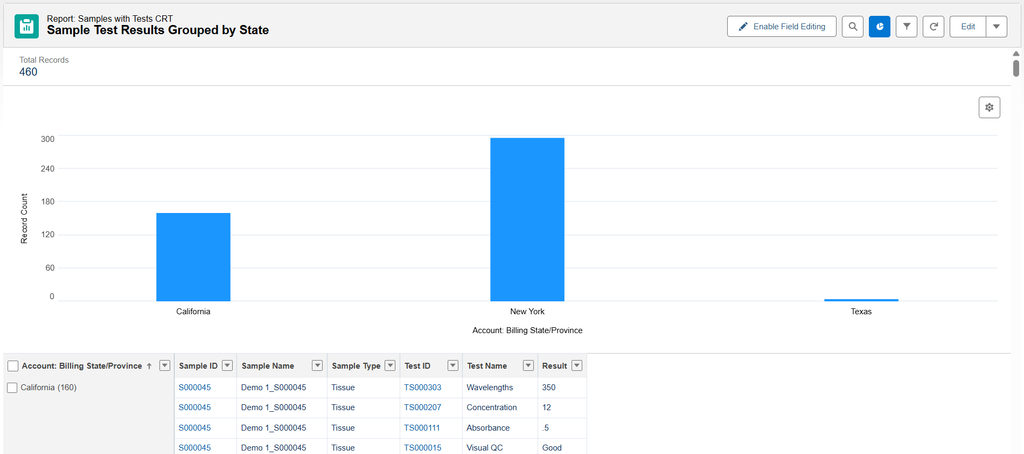
Let’s build the report from the example above: samples with their test results, grouped by state.
Step 1: Create the Report Type
- Go to Setup and search for Report Types in the Quick Find box.
- Click New Custom Report Type.
- Select the Primary Object. For this example, choose Samples.
- Enter a Report Type Label, such as “Samples with Tests.” The Report Type Name (API name) is generated from the label.
- Add a Description, such as “Samples with all associated test records.”
- Under Store in Category, choose the category where users will find the report type.
- Set the Deployment Status. Choose In Development while you are building and testing, and Deployed when it is ready for users.
- Click Next.
Step 2: Define the Report Records Set
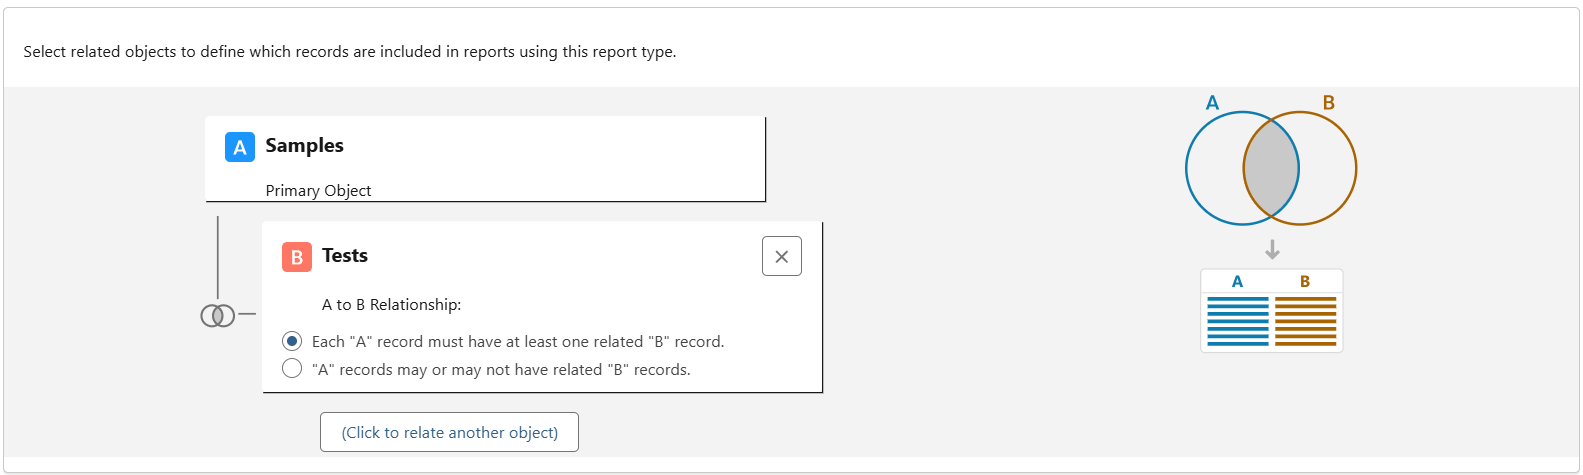
Next, select the related objects that determine which records are included in reports built from this report type. For this example, relate Tests to Samples, then choose how the two objects relate:
- Each “A” record must have at least one related “B” record. The report only includes samples that have test results.
- “A” records may or may not have related “B” records. The report shows all samples, including those without test results.
If you need to go a level deeper, you can relate a third object and define the B-to-C relationship in the same way.
Step 3: Configure the Report Fields
Once the report type is saved, the detail page lists the fields included for each object. Click Edit Layout to control exactly which fields users can access when they build reports with your custom report type. From here you can:
- Mark fields as default so they are added to new reports automatically.
- Reorder fields so the most useful ones are easy to find.
- Click Create New Section to group related fields together.
- Click Add fields related via lookup to pull in fields from connected objects.
Adding lookup fields is the step that solves our state code problem. Click through the blue links to follow your object relationships, such as from Sample to Account, check the boxes next to the fields you want (in this case, the Account’s state code), and click OK. This lets users report on fields from objects that aren’t part of the primary report structure.
Step 4: Build the Report
With the custom report type in place, go to the Reports tab and click New Report.
- Search for and select the Samples with Tests report type.
- Add the columns you need, then group rows by State Code.
- Click Save & Run.
You now have a report that combines samples, their tests, and customer location data, which no standard report type could provide.
Dynamic Dashboards
What Is a Dynamic Dashboard?
A dynamic dashboard automatically adjusts the data it displays based on the permissions and role of the logged-in user who is viewing it. One dashboard can serve a lab technician, a lab manager, and an account manager, with each person seeing only the data they are allowed to see.
Why Use Dynamic Dashboards?
- Fewer dashboards: Admins don’t need to build and maintain a separate dashboard for every persona in the org.
- Stronger security: Users never see records or sensitive data they aren’t authorized to view.
- Relevant data for each user: Metrics update for each viewer based on their current system access.
How to Create a Dynamic Dashboard
The key to a dynamic dashboard is preparing your reports for dynamic viewing:
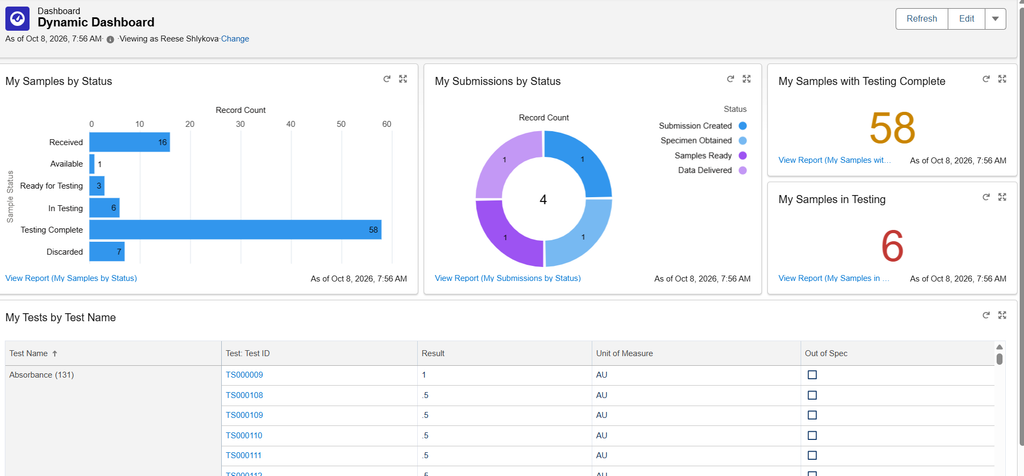
- Build the underlying reports with relative filters, such as My Samples or My Team’s Samples, so the data changes based on who is logged in. For example, a “My Samples by Status” report filtered to show only the samples the viewer owns.
- Save the reports in folders with the correct sharing settings (more on this below).
Then set up the dashboard:
- Create a new dashboard.
- Save it in a public folder so other users can access it.
- Add your reports to the dashboard as components.
- Click Edit on the dashboard, then click the gear icon at the top to open Dashboard Properties.
- Scroll down to the View Dashboard As section.
- Change the setting from Me to The dashboard viewer, or choose Let dashboard viewers choose whom they view the dashboard as.
- Click Save.
That’s it. When you view the dashboard, you see your own samples. When another Lockbox user opens the same dashboard, they see theirs.
Limitations of Dynamic Dashboards
Dynamic dashboards are limited by Salesforce edition. Enterprise Edition orgs can have up to 5 dynamic dashboards, and Unlimited and Performance Edition orgs can have up to 10. Because the number is capped, it is worth planning which dashboards benefit most from dynamic viewing before you build them.
Sharing Reports & Dashboards
Saving reports and dashboards in the right folders with the right access controls is critical. Reports and dashboards can be shared with internal users and with external users, such as customers who log in to your Lockbox portal.
When you first save a report, you are asked to choose a folder. The sharing settings on that folder determine who can access the report:
- Private folder: Only the folder’s owner can see the reports stored inside it.
- Public folder: Access depends on how the folder’s sharing settings are configured.
How to Create a Folder and Configure Sharing
- From the Reports tab, click New Folder.
- Give the folder a label and click Save.
- Click the drop-down arrow beside the folder and select Share.
- Choose who to share with. You can share with specific users, roles, external customers, or public groups. We recommend using public groups.
- Select the access level for each: View, Edit, or Manage.
- Click Share to update the folder’s sharing settings, then click Done.
What is a Public Group?
A public group is a customizable collection of individual users, roles, or other groups that makes data sharing and permission management simpler. Instead of sharing a folder with a long list of individual users, you share it with one group and manage membership in a single place.
How to Create a Public Group
- Go to Setup.
- Search for Public Groups in the Quick Find box.
- Click New.
- Give the public group a label.
- Check Grant Access Using Hierarchies if you want record access to roll up through your role hierarchy.
- Use the Search drop-down to choose the type of members to add, such as Users, Roles, Roles and Subordinates, or other Public Groups.
- Select the entries on the left and click Add to move them to the Selected Members list on the right.
- Click Save.
You can now share reports and dashboard folders with that public group.
Sharing Reports & Dashboards with External Portal Users
One of the most valuable uses of folder sharing is giving customers access to their own data through the Lockbox portal. To share reports and dashboards with portal users:
- Use the default All Customer Portal Users public group, or create a new public group for a specific set of portal users.
- For reports, save them in a folder that is shared with that portal user group.
- For dashboards, make sure the dashboard and every report it uses are stored in folders shared with the portal user group.
Once the dashboard is added to the portal, customers can log in and see up-to-date results without emailing your lab for a status update.
Conclusion
Custom report types, dynamic dashboards, and well-planned sharing settings turn Lockbox LIMS reporting from a list of records into a tool every person in and around your lab can use. Custom report types answer questions that span several objects. Dynamic dashboards give each user a personalized view without multiplying the number of dashboards your admins maintain. And folder sharing with public groups puts the right data in front of the right people, from internal teams to external customers.
See Lockbox LIMS Reports and Dashboards in Action
Want to see how custom reports and dashboards could work with your lab’s data? Schedule a demo with our team.